


The notion of Technical Debt (TD) was introduced to describe the shipment of first-time code with inefficiencies, due to early deployment. To quantify the amount of technical debt, various types of
TD and ways of identification/quantification have been proposed in the literature. But the main
mechanism beneath code TD identification/quantification is source code static analysis, pointing
to classes that violate certain pre-defined quality rules. One of the most known tools for TD
identification/quantification is SonarQube, which is able to quantify the technical debt of projects
written in almost any programming language. However, despite the support for various languages
and programming paradigms, the approach for the quantification of technical debt remains
unchanged, regardless of the system architecture (e.g., whether the software is service-based or
monolithic).
The SmartCLIDE methodology for quantifying the amount of TD that is accumulated within software
services is straightforward. Since a service has a number of different entry points (e.g., endpoints),
we propose that each one of these endpoints deserves its own evaluation of TD. In a way, each
entry point could be treated as a different application, since it provides a distinct functionality. The
benefit lies in the fact that TD analysis can highlight individual end-points which are in need of
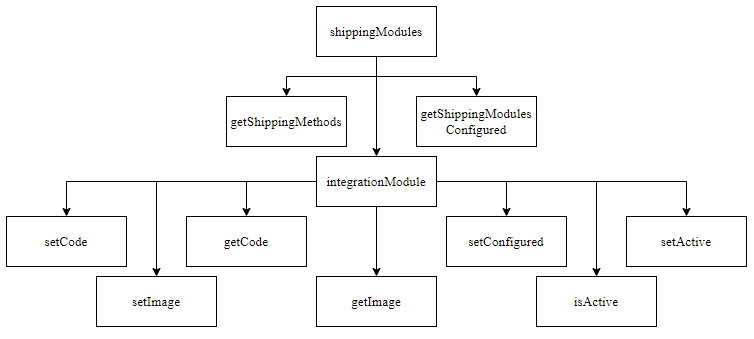
improvement, rather than blaming the entire project. The methodology is based on the generation
of the call graph of the service endpoints. With the term call graph, we refer to the user-defined
methods that are being called successively from a given point in the code. This information is critical
in order to report only the TD issues appearing in the methοds invoked by the given endpoint. By
knowing the total TD issues reported for all the invoked methods, we are able to quantify the
amount of TD that a developer will face, when maintaining the specific endpoint from end-to-end,
as effort (time) and in monetary terms. Finally, this functionality is already part of the SmartCLIDE
IDE.
Illustrative Example: For example, the Shopizer project contains a large number of endpoints as it
exposes its functionalities through a RESTful API. The project-level analysis yields all code
inefficiencies and the time that is needed to resolve them, as follows:
| TD: 478.8h / 14362.5€ Number of Issues: 3426 |
By applying the proposed methodology, we were able to map the total TD to the project endpoint
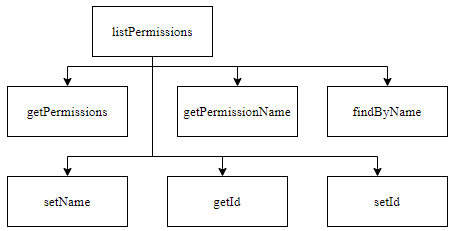
and identified cases for which the total number is not representative. Below, we report our
calculations for two endpoints: namely, Shipping Modules and List Permissions.
| Shipping Modules TD: 22min / 10.5€ Number of Issues: 3 |
| List Permissions TD: 0min / 0€ Number of Issues: 0 |
For more detailed information you can read this paper.

No responses yet